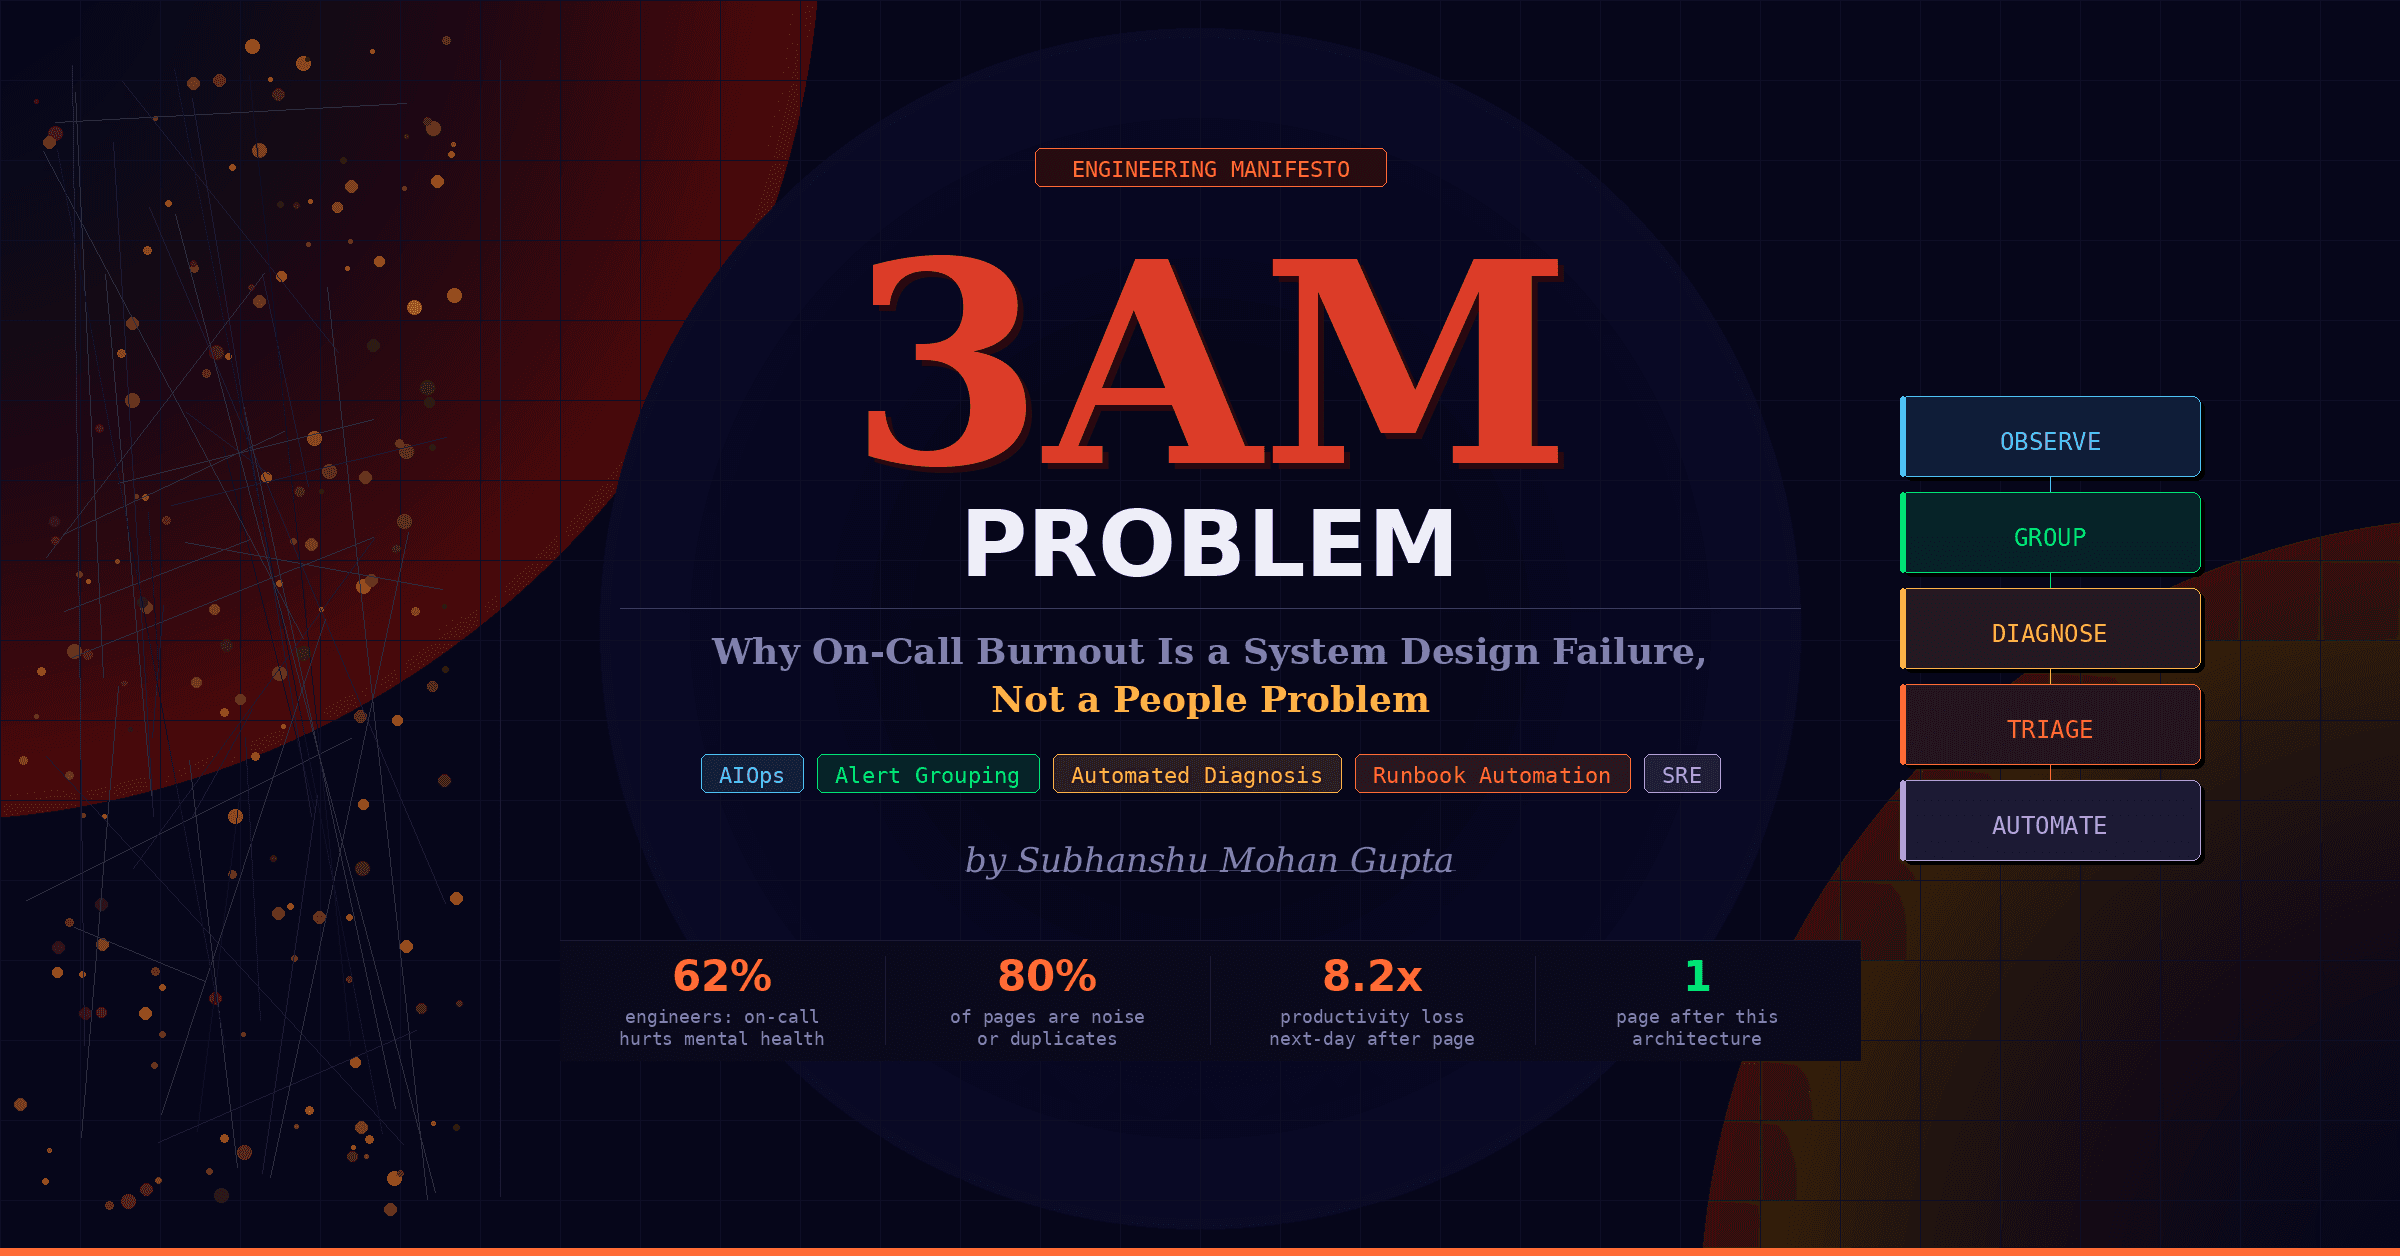
The 3AM Problem: Why On-Call Burnout Is a System Design Failure, Not a People Problem
62% of engineers say on-call rotations have damaged their mental health. 34% quit within 18 months. 80% of alerts are noisy, duplicated, or resolve before the engineer can act. This is not a resilience problem. This is a system design problem and every single root cause has a technical fix.
A versatile DevSecOps Engineer specialized in creating secure, scalable, and efficient systems that bridge development and operations. My expertise lies in automating complex processes, integrating AI-driven solutions, and ensuring seamless, secure delivery pipelines. With a deep understanding of cloud infrastructure, CI/CD, and cybersecurity, I thrive on solving challenges at the intersection of innovation and security, driving continuous improvement in both technology and team dynamics.
The Human Story Behind the Pager
Meet Priya. Senior backend engineer with 5 years of experience, joined a fintech scale-up to build payment infrastructure. She is good at her job.
Then she went on-call.
Week 1 of her first rotation:
Mon 02:14 — ALERT: payment-processor CPU > 90%
Mon 02:41 — ALERT: order-service DB connection pool exhausted
Tue 03:07 — ALERT: kafka consumer lag > 50,000 messages
Wed 01:22 — ALERT: payment-processor CPU > 90%  (same one)
Thu 03:55 — ALERT: auth-service error rate > 5%
Fri 02:01 — ALERT: kafka consumer lag > 50,000 messages  (auto-resolved before she woke up)
Sat 04:30 — ALERT: payment-processor CPU > 90%  (still the same one)
Each page triggers the same ritual. PagerDuty fires. She jolts awake at 3AM. Slacks the team to flag she is on it. Opens five dashboards simultaneously. Reads a runbook authored by an engineer who left 14 months ago, referencing a legacy-payment-v1 service that was deprecated in Q2. Restarts a pod. Watches metrics for 25 minutes. The numbers look stable. She falls back asleep at 4:15AM and shows up to standup at 9AM unable to complete a coherent sentence.
By Thursday she has LinkedIn open in a background tab.
Here is the thing that nobody says out loud at the postmortem: the system worked exactly as it was designed to work. Every alert fired on the threshold it was configured for. PagerDuty escalated correctly. The runbook existed. The monitoring was "in place."
The design itself was the failure.
Root Cause Analysis: Three System Design Failures
When an engineer burns out on-call, organizations reach for the wrong solutions: hire more engineers, add more rotation members, run a resilience workshop, tell people to "set better boundaries." These treat the symptom while the root cause keeps compounding.
There are three concrete, measurable system design failures behind almost every on-call burnout story.
Failure 1: Symptom-Level Alerting with No Signal Intelligence
Most alerting systems are built by people who are not on-call. They set thresholds on individual metrics and call it observability. The result is an alert architecture shaped like this:
CPU > 80%           → PAGE
Memory > 70%        → PAGE
Error rate > 1%     → PAGE
Latency p99 > 2s    → PAGE
DB connections > 80 → PAGE
When a single upstream database becomes slow, every service that touches it will simultaneously breach every one of those thresholds. Five services, five metrics each, four alert rules per metric: the on-call engineer receives 100 pages about one 30-second database hiccup.
This is called an alert storm and it is not a monitoring problem. It is an alert architecture problem. The system has no concept of causality, grouping, or signal-to-noise ratio.
Failure 2: Zero Automated Diagnosis
When Priya gets a page at 3AM, she opens a dashboard. She stares at graphs. She looks at logs. She cross-references metrics across four services. She forms a hypothesis. She validates it. She acts on it.
That entire cognitive loop, from page to diagnosis, takes 12 to 25 minutes on average. And the cruel irony is that 80% of production incidents follow a pattern that has happened before. The playbook exists. The runbook covers it. But the system makes the engineer manually reconstruct the diagnosis every single time, at 3AM, half-asleep, under pressure.
This is not an engineering problem. It is an automation gap: the system is collecting all the data needed to auto-diagnose the issue but forcing a human to do the computation manually.
Failure 3: Runbooks That Are Documents, Not Programs
"Runbook" should mean "a program that runs." In most organizations it means "a Confluence page last updated 11 months ago."
The on-call engineer reads a document, interprets its instructions for the current situation, executes a series of manual commands, and verifies the results themselves. Every step is a potential failure point. Every interpretation is a potential mistake. Every manual command is executed by someone who has been awake for 23 of the last 24 hours.
When runbooks are documents, not programs, the system is relying on human consistency at 3AM to maintain system reliability. This is poor systems thinking.
Real World Case Study: The Payment Gateway Meltdown
Company: A mid-sized e-commerce platform processing $2M/day in transactions.
Stack: Kubernetes on AWS EKS, Postgres RDS, Redis, Kafka, Python microservices, Prometheus, Grafana, PagerDuty.
The incident: Black Friday. Traffic 4x normal. 11:47PM.
What the on-call engineer saw:
11:47 PM — payment-service error rate: 12%
11:47 PM — checkout-service latency p99: 8.2s
11:48 PM — order-service DB connections: 95/100
11:48 PM — inventory-service error rate: 7%
11:49 PM — payment-service CPU: 91%
11:49 PM — checkout-service CPU: 88%
11:49 PM — order-service error rate: 15%
11:49 PM — redis connection timeout alerts: 4 separate alerts
11:50 PM — kafka consumer lag: 120,000 messages
11:50 PM — notification-service error rate: 6%
         ... 23 more alerts over the next 8 minutes ...
31 pages. One engineer. 12 minutes.
What was actually happening (one sentence):
A single connection pool misconfiguration in order-service caused it to exhaust its Postgres connections under load, which cascaded upstream through every service that depended on order data.
One root cause. 31 pages. 47 minutes to diagnose. $380,000 in lost GMV.
What a well-designed system would have done:
11:47 PM — [GROUPED ALERT, 1 page]:
  Root cause candidate: order-service DB connection pool exhaustion
  Evidence: 31 correlated metric anomalies across 6 services
  Affected services: payment, checkout, inventory, order, notification, redis
  Automated diagnosis: Connection pool limit reached (95/100)
  Recommended action: [RUNBOOK-AUTO-007] Scale connection pool, restart order-service
  Confidence: 94%
  Auto-remediation: Ready to execute on approval
One page. One diagnosis. One action. Triggered, reviewed, approved, and resolved in 9 minutes.
The Architecture That Eliminates Burnout

Layer 1: Smart Alert Grouping
📁 GitHub file: alertmanager-config.yaml
Prerequisites
helm repo add prometheus-community https://prometheus-community.github.io/helm-charts
helm repo update

helm install prometheus prometheus-community/kube-prometheus-stack \
  --namespace monitoring \
  --create-namespace \
  --set alertmanager.enabled=true \
  --set grafana.enabled=true
Step 1: Alert Rules with Semantic Labels
📁 GitHub file: prometheus-alert-rules.yaml
The key insight is that every alert rule must carry labels that describe what it means, not just what it measures. These labels power the grouping and inhibition logic downstream.
# prometheus-alert-rules.yaml
apiVersion: monitoring.coreos.com/v1
kind: PrometheusRule
metadata:
  name: application-alerts
  namespace: monitoring
  labels:
    app: kube-prometheus-stack
    release: prometheus
spec:
  groups:
    - name: service.database
      interval: 30s
      rules:
        - alert: DatabaseConnectionPoolExhausted
          expr: |
            (
              pg_stat_activity_count{state="active"}
              / pg_settings_max_connections
            ) > 0.85
          for: 1m
          labels:
            severity: critical
            layer: infrastructure
            impact_type: resource
            root_cause_candidate: "true"
            service: "{{ $labels.service }}"
            runbook: RB-DB-001
          annotations:
            summary: "DB connection pool at {{ $value | humanizePercentage }} capacity"

        - alert: ServiceErrorRateHigh
          expr: |
            (
              rate(http_requests_total{status=~"5.."}[5m])
              / rate(http_requests_total[5m])
            ) > 0.05
          for: 2m
          labels:
            severity: warning
            layer: application
            impact_type: availability
            root_cause_candidate: "false"
            service: "{{ $labels.service }}"
            runbook: RB-APP-001
          annotations:
            summary: "{{ \(labels.service }} error rate {{ \)value | humanizePercentage }}"

        - alert: ServiceLatencyHigh
          expr: |
            histogram_quantile(0.99,
              rate(http_request_duration_seconds_bucket[5m])
            ) > 2
          for: 2m
          labels:
            severity: warning
            layer: application
            impact_type: performance
            root_cause_candidate: "false"
            service: "{{ $labels.service }}"
            runbook: RB-APP-002
          annotations:
            summary: "{{ \(labels.service }} p99 latency {{ \)value | humanizeDuration }}"
Step 2: Alertmanager Config with Intelligent Grouping and Inhibition
📁 GitHub file: alertmanager-config.yaml
# alertmanager-config.yaml
global:
  resolve_timeout: 5m
  slack_api_url: 'YOUR_SLACK_WEBHOOK_URL'

# If a root cause alert fires, suppress all downstream symptom alerts.
# This is the single biggest reducer of alert volume.
inhibit_rules:
  - source_matchers:
      - 'alertname="DatabaseConnectionPoolExhausted"'
      - 'root_cause_candidate="true"'
    target_matchers:
      - 'root_cause_candidate="false"'
      - 'layer="application"'
    equal: ['namespace']

  - source_matchers:
      - 'layer="infrastructure"'
      - 'severity="critical"'
    target_matchers:
      - 'layer="application"'
      - 'severity="warning"'
    equal: ['namespace']

  - source_matchers:
      - 'severity="critical"'
    target_matchers:
      - 'severity="warning"'
    equal: ['alertname', 'service', 'namespace']

route:
  group_by: ['namespace', 'layer', 'impact_type']
  group_wait: 30s
  group_interval: 5m
  repeat_interval: 4h
  receiver: 'diagnosis-engine'

  routes:
    - matchers:
        - 'severity="critical"'
        - 'layer="infrastructure"'
      group_wait: 10s
      group_interval: 2m
      receiver: 'diagnosis-engine'
      continue: false

    - matchers:
        - 'layer="application"'
      group_by: ['namespace', 'service', 'impact_type']
      group_wait: 45s
      receiver: 'diagnosis-engine'
      continue: false

    - matchers:
        - 'severity="warning"'
      repeat_interval: 1h
      receiver: 'slack-warnings'
      continue: false

receivers:
  - name: 'diagnosis-engine'
    webhook_configs:
      - url: 'http://diagnosis-engine.monitoring.svc.cluster.local:8080/alerts'
        send_resolved: true

  - name: 'slack-warnings'
    slack_configs:
      - channel: '#oncall-warnings'
        title: 'Warning: {{ .GroupLabels.alertname }}'
        text: |
          *Alerts:* {{ len .Alerts }}
          *Namespace:* {{ .GroupLabels.namespace }}
Apply this config:
kubectl apply -f alertmanager-config.yaml

kubectl -n monitoring exec -it alertmanager-prometheus-kube-prometheus-alertmanager-0 \
  -- amtool config show
Layer 2: Automated Diagnosis Engine
Project Structure
oncall-burnout-fix/
├── Dockerfile
├── requirements.txt
├── main.py
├── alertmanager-config.yaml
├── docker-compose.yml
├── src/
│   ├── models.py
│   ├── graph.py
│   ├── correlator.py
│   ├── diagnosis.py
│   ├── aiops.py
│   ├── history.py
│   └── runbook_handler.py
├── playbooks/
│   └── db-connection-pool-fix.yml
├── tests/
│   ├── test_diagnosis.py
│   └── test_integration.py
└── k8s/
    └── deployment.yaml
requirements.txt
📁 GitHub file: requirements.txt
fastapi==0.109.0
uvicorn==0.27.0
pydantic==2.5.3
httpx==0.26.0
networkx==3.2.1
prometheus-api-client==0.5.4
redis==5.0.1
numpy==1.26.3
scikit-learn==1.4.0
structlog==24.1.0
tenacity==8.2.3
pytest==7.4.4
pytest-asyncio==0.23.3
Data contract layer
from pydantic import BaseModel, Field
from typing import Optional, Literal
from datetime import datetime
from enum import Enum


class AlertSeverity(str, Enum):
    CRITICAL = "critical"
    WARNING  = "warning"
    INFO     = "info"


class AlertLabel(BaseModel):
    alertname: str
    severity: AlertSeverity
    layer: str
    impact_type: str
    root_cause_candidate: bool = False
    service: Optional[str] = None
    namespace: str = "default"
    runbook: Optional[str] = None


class Alert(BaseModel):
    status: Literal["firing", "resolved"]
    labels: AlertLabel
    annotations: dict
    starts_at: datetime = Field(alias="startsAt")
    ends_at: Optional[datetime] = Field(None, alias="endsAt")
    generator_url: str = Field("", alias="generatorURL")
    fingerprint: str = ""

    class Config:
        populate_by_name = True


class AlertBundle(BaseModel):
    version: str = "4"
    group_key: str = Field(alias="groupKey")
    status: Literal["firing", "resolved"]
    receiver: str
    group_labels: dict = Field(alias="groupLabels")
    common_labels: dict = Field(alias="commonLabels")
    common_annotations: dict = Field(alias="commonAnnotations")
    alerts: list[Alert]

    class Config:
        populate_by_name = True


class DiagnosisResult(BaseModel):
    incident_id: str
    root_cause_alert: Optional[str]
    root_cause_service: Optional[str]
    root_cause_description: str
    affected_services: list[str]
    confidence_score: float
    alert_count: int
    deduplicated_alert_count: int
    recommended_runbook: Optional[str]
    supporting_metrics: dict
    historical_match: Optional[str]
    created_at: datetime
Service Dependency Graph
import networkx as nx
from typing import Optional
import json
import structlog

log = structlog.get_logger()


class ServiceDependencyGraph:
    """
    Directed graph of service dependencies.
    Edge A -> B means A calls B. If B fails, A is affected.
    """

    def __init__(self):
        self.graph = nx.DiGraph()
        self._build_default_graph()

    def _build_default_graph(self):
        services = [
            "payment-service", "checkout-service", "order-service",
            "inventory-service", "notification-service",
            "postgres-rds", "redis-cache", "kafka",
        ]
        dependencies = [
            ("payment-service",      "order-service"),
            ("payment-service",      "redis-cache"),
            ("checkout-service",     "payment-service"),
            ("checkout-service",     "inventory-service"),
            ("checkout-service",     "order-service"),
            ("order-service",        "postgres-rds"),
            ("order-service",        "kafka"),
            ("inventory-service",    "postgres-rds"),
            ("notification-service", "kafka"),
        ]
        for s in services:
            self.graph.add_node(s)
        for caller, dep in dependencies:
            self.graph.add_edge(caller, dep)

    def get_upstream_services(self, service: str) -> list[str]:
        if service not in self.graph:
            return []
        return list(self.graph.predecessors(service))

    def get_downstream_services(self, service: str) -> list[str]:
        if service not in self.graph:
            return []
        return list(self.graph.successors(service))

    def find_likely_root_cause(self, affected_services: list[str]) -> Optional[str]:
        if not affected_services:
            return None
        affected_set = set(affected_services)
        scores = {}
        for service in affected_services:
            if service not in self.graph:
                continue
            upstream = set(self.graph.predecessors(service))
            scores[service] = len(upstream.intersection(affected_set))
        if not scores:
            return affected_services[0]
        return max(scores, key=scores.get)

    def get_impact_radius(self, root_service: str) -> list[str]:
        if root_service not in self.graph:
            return []
        impacted, queue = set(), [root_service]
        while queue:
            current = queue.pop(0)
            for pred in self.graph.predecessors(current):
                if pred not in impacted:
                    impacted.add(pred)
                    queue.append(pred)
        return list(impacted)

    def load_from_file(self, path: str):
        with open(path) as f:
            data = json.load(f)
        self.graph.clear()
        for node in data.get("nodes", []):
            self.graph.add_node(node)
        for edge in data.get("edges", []):
            self.graph.add_edge(edge["from"], edge["to"])
Metric Correlation Analysis
📁 GitHub file: src/correlator.py
import numpy as np
from datetime import datetime, timedelta
import httpx
import structlog
from tenacity import retry, stop_after_attempt, wait_exponential

log = structlog.get_logger()
PROMETHEUS_URL = "http://prometheus-operated.monitoring.svc.cluster.local:9090"


class MetricCorrelator:

    def __init__(self, prometheus_url: str = PROMETHEUS_URL):
        self.prometheus_url = prometheus_url
        self.client = httpx.AsyncClient(timeout=10.0)

    @retry(stop=stop_after_attempt(3), wait=wait_exponential(multiplier=1, min=2, max=8))
    async def fetch_metric(
        self, query: str, start: datetime, end: datetime, step: str = "30s"
    ) -> list[float]:
        params = {
            "query": query,
            "start": start.timestamp(),
            "end":   end.timestamp(),
            "step":  step,
        }
        try:
            r = await self.client.get(
                f"{self.prometheus_url}/api/v1/query_range", params=params
            )
            r.raise_for_status()
            data = r.json()
            if data["status"] != "success":
                return []
            results = data.get("data", {}).get("result", [])
            if not results:
                return []
            return [float(v[1]) for v in results[0]["values"]]
        except Exception as e:
            log.error("prometheus_fetch_error", query=query, error=str(e))
            return []

    async def compute_correlation(
        self, metric_a: list[float], metric_b: list[float]
    ) -> float:
        if len(metric_a) < 3 or len(metric_b) < 3:
            return 0.0
        min_len = min(len(metric_a), len(metric_b))
        a, b = np.array(metric_a[:min_len]), np.array(metric_b[:min_len])
        if np.std(a) == 0 or np.std(b) == 0:
            return 0.0
        corr = np.corrcoef(a, b)[0, 1]
        return float(corr) if not np.isnan(corr) else 0.0

    async def compute_anomaly_score(self, values: list[float]) -> float:
        if len(values) < 5:
            return 0.0
        historical = np.array(values[:-1])
        latest = values[-1]
        mean, std = np.mean(historical), np.std(historical)
        if std == 0:
            return 0.0
        return min(abs((latest - mean) / std) / 5.0, 1.0)

    async def validate_db_connection_hypothesis(
        self, service: str, incident_start: datetime
    ) -> dict:
        end   = incident_start + timedelta(minutes=10)
        start = incident_start - timedelta(minutes=5)
        db_q  = f'pg_stat_activity_count{{service="{service}",state="active"}}'
        err_q = f'rate(http_requests_total{{service="{service}",status=~"5.."}}[2m])'
        db_vals  = await self.fetch_metric(db_q,  start, end)
        err_vals = await self.fetch_metric(err_q, start, end)
        correlation = await self.compute_correlation(db_vals, err_vals)
        db_anomaly  = await self.compute_anomaly_score(db_vals)
        return {
            "hypothesis": "db_connection_exhaustion",
            "correlation_coefficient": correlation,
            "db_anomaly_score": db_anomaly,
            "supports_hypothesis": correlation > 0.7 and db_anomaly > 0.6,
            "db_connection_values": db_vals[-3:]  if db_vals  else [],
            "error_rate_values":    err_vals[-3:] if err_vals else [],
        }

    async def close(self):
        await self.client.aclose()
Root Cause Analysis Engine
📁 GitHub file: src/diagnosis.py
import uuid, math
import structlog
from datetime import datetime
from typing import Optional

from .models import AlertBundle, DiagnosisResult, AlertSeverity
from .graph import ServiceDependencyGraph
from .correlator import MetricCorrelator
from .history import IncidentHistory

log = structlog.get_logger()


class DiagnosisEngine:

    def __init__(self):
        self.graph      = ServiceDependencyGraph()
        self.correlator = MetricCorrelator()
        self.history    = IncidentHistory()

    async def diagnose(self, bundle: AlertBundle) -> DiagnosisResult:
        incident_id    = str(uuid.uuid4())[:8]
        firing_alerts  = [a for a in bundle.alerts if a.status == "firing"]
        incident_start = min(a.starts_at for a in firing_alerts)

        # 1. Extract affected services
        affected_services = list(set(
            a.labels.service for a in firing_alerts if a.labels.service
        ))

        # 2. Find explicit root cause candidates from alert labels
        root_cause_candidates = [
            a for a in firing_alerts
            if a.labels.root_cause_candidate and a.labels.service
        ]

        # 3. Fall back to graph traversal if no explicit candidates
        if root_cause_candidates:
            root_cause_service = root_cause_candidates[0].labels.service
            root_cause_alert   = root_cause_candidates[0].labels.alertname
        else:
            root_cause_service = self.graph.find_likely_root_cause(affected_services)
            root_cause_alert   = next(
                (a.labels.alertname for a in firing_alerts
                 if a.labels.service == root_cause_service),
                None
            )

        # 4. Validate with metric correlation
        correlation_data = {}
        if root_cause_service:
            correlation_data = await self.correlator.validate_db_connection_hypothesis(
                root_cause_service, incident_start
            )

        # 5. Historical pattern matching
        historical_match = await self.history.find_similar_incident(
            affected_services=affected_services,
            root_cause_alert=root_cause_alert,
        )

        # 6. Score confidence
        confidence = self._compute_confidence(
            has_explicit_candidate=bool(root_cause_candidates),
            correlation_data=correlation_data,
            has_historical_match=historical_match is not None,
            alert_count=len(firing_alerts),
            affected_service_count=len(affected_services),
        )

        result = DiagnosisResult(
            incident_id=incident_id,
            root_cause_alert=root_cause_alert,
            root_cause_service=root_cause_service,
            root_cause_description=self._build_description(
                root_cause_service, root_cause_alert,
                affected_services, firing_alerts, correlation_data
            ),
            affected_services=affected_services,
            confidence_score=confidence,
            alert_count=len(bundle.alerts),
            deduplicated_alert_count=len(firing_alerts),
            recommended_runbook=self._select_runbook(
                root_cause_alert, root_cause_candidates, historical_match
            ),
            supporting_metrics=correlation_data,
            historical_match=historical_match,
            created_at=datetime.utcnow(),
        )
        await self.history.store_incident(result, bundle)
        return result

    def _compute_confidence(
        self, has_explicit_candidate, correlation_data,
        has_historical_match, alert_count, affected_service_count
    ) -> float:
        score = 0.0
        if has_explicit_candidate:
            score += 0.40
        if correlation_data.get("supports_hypothesis"):
            score += 0.30
        elif correlation_data.get("correlation_coefficient", 0) > 0.5:
            score += 0.15
        if has_historical_match:
            score += 0.20
        score += min(math.log(alert_count + 1) / 20, 0.10)
        return round(min(score, 1.0), 3)

    def _select_runbook(self, root_cause_alert, root_cause_candidates, historical_match):
        if root_cause_candidates and root_cause_candidates[0].labels.runbook:
            return root_cause_candidates[0].labels.runbook
        if historical_match:
            return historical_match
        return {
            "DatabaseConnectionPoolExhausted": "RB-DB-001",
            "ServiceErrorRateHigh":            "RB-APP-001",
            "KafkaConsumerLagHigh":            "RB-KAFKA-001",
            "ServiceLatencyHigh":              "RB-APP-002",
        }.get(root_cause_alert)

    def _build_description(
        self, root_cause_service, root_cause_alert,
        affected_services, firing_alerts, correlation_data
    ) -> str:
        lines = []
        if root_cause_service and root_cause_alert:
            lines.append(f"Root cause: {root_cause_alert} on {root_cause_service}")
        if affected_services:
            lines.append(f"Cascade affecting: {', '.join(affected_services)}")
        if correlation_data.get("supports_hypothesis"):
            r = correlation_data.get("correlation_coefficient", 0)
            lines.append(f"Metric correlation confirms hypothesis (r={r:.2f})")
        critical = sum(
            1 for a in firing_alerts if a.labels.severity == AlertSeverity.CRITICAL
        )
        if critical:
            lines.append(f"{critical} critical alerts deduplicated into this incident")
        return ". ".join(lines) + "."
Pattern Store
📁 GitHub file: src/history.py
import redis.asyncio as redis
import structlog
from typing import Optional
from datetime import datetime
from .models import DiagnosisResult, AlertBundle

log = structlog.get_logger()
REDIS_URL = "redis://redis.monitoring.svc.cluster.local:6379"


class IncidentHistory:

    def __init__(self):
        self._client: Optional[redis.Redis] = None

    async def _get_client(self) -> redis.Redis:
        if not self._client:
            self._client = await redis.from_url(REDIS_URL, decode_responses=True)
        return self._client

    def _fingerprint(
        self, affected_services: list[str], root_cause_alert: Optional[str]
    ) -> str:
        return f"{root_cause_alert or 'unknown'}::{','.join(sorted(affected_services))}"

    async def find_similar_incident(
        self, affected_services: list[str], root_cause_alert: Optional[str]
    ) -> Optional[str]:
        try:
            client = await self._get_client()
            fp     = self._fingerprint(affected_services, root_cause_alert)
            return await client.hget(f"incident:pattern:{fp}", "recommended_runbook")
        except Exception as e:
            log.warning("history_lookup_failed", error=str(e))
            return None

    async def store_incident(self, result: DiagnosisResult, bundle: AlertBundle):
        try:
            client = await self._get_client()
            fp     = self._fingerprint(result.affected_services, result.root_cause_alert)
            key    = f"incident:pattern:{fp}"
            prev   = int(await client.hget(key, "occurrence_count") or "0")
            await client.hset(key, mapping={
                "root_cause_alert":    result.root_cause_alert   or "",
                "root_cause_service":  result.root_cause_service or "",
                "recommended_runbook": result.recommended_runbook or "",
                "confidence":          str(result.confidence_score),
                "last_seen":           datetime.utcnow().isoformat(),
                "occurrence_count":    str(prev + 1),
            })
            await client.expire(key, 60 * 60 * 24 * 90)
        except Exception as e:
            log.warning("history_store_failed", error=str(e))
FastAPI Application
📁 GitHub file: main.py
from fastapi import FastAPI, HTTPException, Header
from contextlib import asynccontextmanager
import structlog

from src.models import AlertBundle, DiagnosisResult
from src.diagnosis import DiagnosisEngine
from src.aiops import AIOpsTriageEngine

log = structlog.get_logger()


@asynccontextmanager
async def lifespan(app: FastAPI):
    log.info("diagnosis_engine_starting")
    yield
    log.info("diagnosis_engine_stopping")


app = FastAPI(
    title="On-Call Diagnosis Engine",
    version="1.0.0",
    lifespan=lifespan,
)

diagnosis_engine = DiagnosisEngine()
aiops_engine     = AIOpsTriageEngine()


@app.post("/alerts", response_model=DiagnosisResult)
async def receive_alerts(bundle: AlertBundle, authorization: str = Header(None)):
    if bundle.status == "resolved":
        log.info("incident_resolved", group_key=bundle.group_key)
        return {"message": "resolved"}
    try:
        diagnosis = await diagnosis_engine.diagnose(bundle)
        triage    = await aiops_engine.triage(diagnosis, bundle)
        await aiops_engine.notify_oncall(triage, diagnosis)
        return diagnosis
    except Exception as e:
        log.error("diagnosis_failed", error=str(e), exc_info=True)
        raise HTTPException(status_code=500, detail=str(e))


@app.get("/health")
async def health():
    return {"status": "ok"}
Layer 3: AIOps Triage with LLMs
import os, json
import httpx
import structlog
from .models import DiagnosisResult, AlertBundle

log = structlog.get_logger()
SLACK_WEBHOOK_URL = os.environ.get("SLACK_WEBHOOK_URL")
OPENAI_API_KEY    = os.environ.get("OPENAI_API_KEY")


class AIOpsTriageEngine:

    def __init__(self):
        self.client = httpx.AsyncClient(timeout=30.0)

    async def triage(self, diagnosis: DiagnosisResult, bundle: AlertBundle) -> dict:
        prompt = self._build_triage_prompt(diagnosis, bundle)
        try:
            r = await self.client.post(
                "https://api.openai.com/v1/chat/completions",
                headers={
                    "Authorization": f"Bearer {OPENAI_API_KEY}",
                    "Content-Type": "application/json",
                },
                json={
                    "model": "gpt-4-turbo-preview",
                    "temperature": 0.1,
                    "max_tokens": 800,
                    "response_format": {"type": "json_object"},
                    "messages": [
                        {
                            "role": "system",
                            "content": (
                                "You are an expert SRE assistant. "
                                "Given an incident diagnosis, produce a clear, concise "
                                "JSON triage package. Be specific, not generic. "
                                "Use technical language for a senior engineer at 3AM. "
                                "No fluff, no padding."
                            ),
                        },
                        {"role": "user", "content": prompt},
                    ],
                },
            )
            r.raise_for_status()
            return json.loads(r.json()["choices"][0]["message"]["content"])
        except Exception as e:
            log.error("aiops_triage_failed", error=str(e))
            return self._fallback_triage(diagnosis)

    def _build_triage_prompt(self, diagnosis: DiagnosisResult, bundle: AlertBundle) -> str:
        alert_names = [a.labels.alertname for a in bundle.alerts if a.status == "firing"]
        return f"""
Incident diagnosis:
Root cause alert: {diagnosis.root_cause_alert}
Root cause service: {diagnosis.root_cause_service}
Description: {diagnosis.root_cause_description}
Affected: {', '.join(diagnosis.affected_services)}
Alert count before dedup: {diagnosis.alert_count}
Alert count after dedup: {diagnosis.deduplicated_alert_count}
Confidence: {diagnosis.confidence_score:.0%}
Runbook: {diagnosis.recommended_runbook}
Historical match: {diagnosis.historical_match or 'None'}
Alerts: {', '.join(alert_names[:10])}

Return JSON with keys:
one_line_summary, what_is_happening, immediate_action,
steps (array), do_not_do, estimated_resolution_time, escalate_if
"""

    def _fallback_triage(self, diagnosis: DiagnosisResult) -> dict:
        return {
            "one_line_summary": diagnosis.root_cause_description,
            "what_is_happening": f"Cascade from {diagnosis.root_cause_service}.",
            "immediate_action": f"Check runbook {diagnosis.recommended_runbook}",
            "steps": ["Check root cause service logs", "Verify metric stabilization"],
            "do_not_do": "Do not restart all services simultaneously",
            "estimated_resolution_time": "15-30",
            "escalate_if": "Issue persists after 30 minutes",
        }

    async def notify_oncall(self, triage: dict, diagnosis: DiagnosisResult):
        confidence_emoji = (
            "🟢" if diagnosis.confidence_score > 0.8
            else "🟡" if diagnosis.confidence_score > 0.6
            else "🔴"
        )
        payload = {
            "blocks": [
                {
                    "type": "header",
                    "text": {
                        "type": "plain_text",
                        "text": f"INCIDENT {diagnosis.incident_id.upper()} — {triage['one_line_summary']}",
                    },
                },
                {
                    "type": "section",
                    "fields": [
                        {"type": "mrkdwn",
                         "text": f"*Root Cause:*\n`{diagnosis.root_cause_alert}` on `{diagnosis.root_cause_service}`"},
                        {"type": "mrkdwn",
                         "text": f"*Confidence:*\n{confidence_emoji} {diagnosis.confidence_score:.0%}"},
                        {"type": "mrkdwn",
                         "text": f"*Affected:*\n{', '.join(f'`{s}`' for s in diagnosis.affected_services)}"},
                        {"type": "mrkdwn",
                         "text": f"*Dedup:*\n{diagnosis.deduplicated_alert_count} alerts to 1 page"},
                    ],
                },
                {"type": "divider"},
                {
                    "type": "section",
                    "text": {
                        "type": "mrkdwn",
                        "text": (
                            f"*What is happening:*\n{triage['what_is_happening']}\n\n"
                            f"*Immediate action:*\n{triage['immediate_action']}\n\n"
                            f"*Steps:*\n"
                            + "\n".join(f"{i+1}. {s}" for i, s in enumerate(triage["steps"]))
                            + f"\n\n*Do NOT:* {triage['do_not_do']}"
                        ),
                    },
                },
                {"type": "divider"},
                {
                    "type": "actions",
                    "elements": [
                        {
                            "type": "button",
                            "text": {"type": "plain_text", "text": "Approve Auto-Fix"},
                            "style": "primary",
                            "value": json.dumps({
                                "action": "auto_fix",
                                "incident_id": diagnosis.incident_id,
                                "runbook": diagnosis.recommended_runbook,
                            }),
                        },
                        {
                            "type": "button",
                            "text": {"type": "plain_text", "text": "Run Manually"},
                            "value": json.dumps({
                                "action": "manual",
                                "incident_id": diagnosis.incident_id,
                                "runbook": diagnosis.recommended_runbook,
                            }),
                        },
                        {
                            "type": "button",
                            "text": {"type": "plain_text", "text": "Escalate"},
                            "style": "danger",
                            "value": json.dumps({
                                "action": "escalate",
                                "incident_id": diagnosis.incident_id,
                            }),
                        },
                    ],
                },
            ]
        }
        try:
            r = await self.client.post(SLACK_WEBHOOK_URL, json=payload)
            r.raise_for_status()
        except Exception as e:
            log.error("slack_notification_failed", error=str(e))

    async def close(self):
        await self.client.aclose()
Layer 4: Runbook Automation with Ansible
📁 GitHub file: src/runbook_handler.py
from fastapi import APIRouter, Request
import json, asyncio
import structlog

log = structlog.get_logger()
router = APIRouter()

RUNBOOK_PLAYBOOKS = {
    "RB-DB-001":    "playbooks/db-connection-pool-fix.yml",
    "RB-APP-001":   "playbooks/app-restart-graceful.yml",
    "RB-KAFKA-001": "playbooks/kafka-consumer-reset.yml",
    "RB-APP-002":   "playbooks/app-scale-horizontal.yml",
}


@router.post("/slack/actions")
async def handle_slack_action(request: Request):
    form_data   = await request.form()
    payload     = json.loads(form_data["payload"])
    action      = payload["actions"][0]
    action_data = json.loads(action["value"])

    action_type = action_data["action"]
    incident_id = action_data["incident_id"]
    runbook     = action_data.get("runbook")

    if action_type == "auto_fix" and runbook in RUNBOOK_PLAYBOOKS:
        asyncio.create_task(execute_runbook(
            runbook_id=runbook,
            incident_id=incident_id,
            triggered_by=payload["user"]["name"],
        ))
        return {"text": f"Auto-fix triggered. Running {runbook} for incident {incident_id}."}
    elif action_type == "escalate":
        return {"text": f"Escalating incident {incident_id}."}
    elif action_type == "manual":
        playbook = RUNBOOK_PLAYBOOKS.get(runbook, "unknown")
        return {"text": f"Manual mode:\n```ansible-playbook {playbook} -e incident_id={incident_id}```"}

    return {"text": "Action acknowledged."}


async def execute_runbook(runbook_id: str, incident_id: str, triggered_by: str):
    playbook = RUNBOOK_PLAYBOOKS.get(runbook_id)
    if not playbook:
        log.error("unknown_runbook", runbook_id=runbook_id)
        return
    cmd = [
        "ansible-playbook", playbook,
        "-e", f"incident_id={incident_id}",
        "-e", f"triggered_by={triggered_by}",
        "-e", f"runbook_id={runbook_id}",
        "--diff",
    ]
    proc = await asyncio.create_subprocess_exec(
        *cmd,
        stdout=asyncio.subprocess.PIPE,
        stderr=asyncio.subprocess.STDOUT,
    )
    stdout, _ = await proc.communicate()
    output = stdout.decode()
    if proc.returncode == 0:
        log.info("runbook_succeeded", incident_id=incident_id, tail=output[-500:])
    else:
        log.error("runbook_failed",   incident_id=incident_id, tail=output[-500:])
DB connection pool fixes
📁 GitHub file: playbooks/db-connection-pool-fix.yml
---
- name: "RB-DB-001: Database Connection Pool Exhaustion Fix"
  hosts: localhost
  gather_facts: false
  vars:
    namespace: "production"
    service: "order-service"
    max_connections_multiplier: 1.5

  tasks:
    - name: Get current deployment config
      kubernetes.core.k8s_info:
        api_version: apps/v1
        kind: Deployment
        name: "{{ service }}"
        namespace: "{{ namespace }}"
      register: deployment_info

    - name: Fail if deployment not found
      ansible.builtin.fail:
        msg: "Deployment {{ service }} not found in {{ namespace }}"
      when: deployment_info.resources | length == 0

    - name: Extract current DB pool size from env
      ansible.builtin.set_fact:
        current_pool_size: >-
          {{
            deployment_info.resources[0].spec.template.spec.containers[0].env
            | selectattr('name', 'eq', 'DB_POOL_SIZE')
            | map(attribute='value')
            | first | default('10') | int
          }}

    - name: Compute new pool size (capped at 50)
      ansible.builtin.set_fact:
        new_pool_size: >-
          {{ [(current_pool_size | int * max_connections_multiplier) | int, 50] | min }}

    - name: Patch deployment with new pool size
      kubernetes.core.k8s:
        state: present
        definition:
          apiVersion: apps/v1
          kind: Deployment
          metadata:
            name: "{{ service }}"
            namespace: "{{ namespace }}"
            annotations:
              remediation/incident-id:  "{{ incident_id }}"
              remediation/triggered-by: "{{ triggered_by }}"
              remediation/runbook:      "{{ runbook_id }}"
              remediation/timestamp:    "{{ ansible_date_time.iso8601 }}"
          spec:
            template:
              spec:
                containers:
                  - name: "{{ service }}"
                    env:
                      - name: DB_POOL_SIZE
                        value: "{{ new_pool_size | string }}"

    - name: Wait for rollout to complete
      kubernetes.core.k8s_rollout_status:
        name: "{{ service }}"
        namespace: "{{ namespace }}"
        timeout: 120

    - name: Verify connection pool metric improved
      ansible.builtin.uri:
        url: >-
          http://prometheus-operated.monitoring.svc.cluster.local:9090/api/v1/query
          ?query=pg_stat_activity_count{service="{{ service }}",state="active"}
        method: GET
        return_content: true
      register: metric_check
      retries: 6
      delay: 10
      until: >-
        (metric_check.json.data.result[0].value[1] | float)
        < (new_pool_size | int * 0.7)

    - name: Report success
      ansible.builtin.debug:
        msg: >
          RB-DB-001 complete.
          Pool scaled {{ current_pool_size }} to {{ new_pool_size }}.
          Incident {{ incident_id }} resolved.
End-to-End Testing
Unit Tests
📁 GitHub file: tests/test_diagnosis.py
import pytest
from datetime import datetime
from unittest.mock import AsyncMock
from src.models import AlertBundle
from src.graph import ServiceDependencyGraph
from src.diagnosis import DiagnosisEngine


def make_alert(alertname, service, severity="warning",
               root_cause_candidate=False, layer="application"):
    return {
        "status": "firing",
        "labels": {
            "alertname": alertname, "severity": severity, "layer": layer,
            "impact_type": "availability",
            "root_cause_candidate": str(root_cause_candidate).lower(),
            "service": service, "namespace": "production",
            "runbook": f"RB-{alertname[:3].upper()}-001",
        },
        "annotations": {"summary": f"Test alert for {service}"},
        "startsAt": datetime.utcnow().isoformat() + "Z",
        "endsAt": "0001-01-01T00:00:00Z",
        "generatorURL": "http://prometheus/graph",
        "fingerprint": f"fp-{alertname}-{service}",
    }


def make_bundle(alerts):
    return {
        "version": "4", "groupKey": "{}:{}", "status": "firing",
        "receiver": "diagnosis-engine",
        "groupLabels": {"namespace": "production"},
        "commonLabels": {"namespace": "production"},
        "commonAnnotations": {}, "alerts": alerts,
    }


class TestServiceDependencyGraph:
    def setup_method(self):
        self.graph = ServiceDependencyGraph()

    def test_upstream_services(self):
        upstream = self.graph.get_upstream_services("order-service")
        assert "payment-service" in upstream
        assert "checkout-service" in upstream

    def test_downstream_services(self):
        downstream = self.graph.get_downstream_services("order-service")
        assert "postgres-rds" in downstream
        assert "kafka" in downstream

    def test_root_cause_identification(self):
        affected = ["payment-service", "checkout-service", "order-service"]
        root = self.graph.find_likely_root_cause(affected)
        assert root == "order-service"

    def test_empty_services(self):
        assert self.graph.find_likely_root_cause([]) is None

    def test_impact_radius(self):
        impacted = self.graph.get_impact_radius("postgres-rds")
        assert "order-service"     in impacted
        assert "inventory-service" in impacted


@pytest.mark.asyncio
class TestDiagnosisEngine:
    async def setup_method(self, method):
        self.engine = DiagnosisEngine()
        self.engine.correlator.validate_db_connection_hypothesis = AsyncMock(
            return_value={
                "correlation_coefficient": 0.87,
                "db_anomaly_score": 0.82,
                "supports_hypothesis": True,
            }
        )
        self.engine.history.find_similar_incident = AsyncMock(return_value="RB-DB-001")
        self.engine.history.store_incident        = AsyncMock()

    async def test_explicit_root_cause(self):
        bundle = AlertBundle(**make_bundle([
            make_alert("DatabaseConnectionPoolExhausted", "order-service",
                       severity="critical", root_cause_candidate=True,
                       layer="infrastructure"),
            make_alert("ServiceErrorRateHigh",  "payment-service"),
            make_alert("ServiceErrorRateHigh",  "checkout-service"),
        ]))
        result = await self.engine.diagnose(bundle)
        assert result.root_cause_service == "order-service"
        assert result.root_cause_alert   == "DatabaseConnectionPoolExhausted"
        assert result.confidence_score    > 0.7
        assert result.recommended_runbook == "RB-DB-001"

    async def test_graph_traversal_fallback(self):
        bundle = AlertBundle(**make_bundle([
            make_alert("ServiceErrorRateHigh", "payment-service"),
            make_alert("ServiceErrorRateHigh", "checkout-service"),
            make_alert("ServiceErrorRateHigh", "order-service"),
        ]))
        result = await self.engine.diagnose(bundle)
        assert result.root_cause_service == "order-service"

    async def test_low_confidence_without_correlation(self):
        self.engine.correlator.validate_db_connection_hypothesis = AsyncMock(
            return_value={"correlation_coefficient": 0.2,
                          "db_anomaly_score": 0.1, "supports_hypothesis": False}
        )
        self.engine.history.find_similar_incident = AsyncMock(return_value=None)
        bundle = AlertBundle(**make_bundle([
            make_alert("ServiceErrorRateHigh", "payment-service")
        ]))
        result = await self.engine.diagnose(bundle)
        assert result.confidence_score < 0.6
Integration Test: Full Pipeline Simulation
📁 GitHub file: tests/test_integration.py
import pytest
import httpx

BASE_URL = "http://localhost:8080"

PAYMENT_CASCADE = {
    "version": "4",
    "groupKey": '{/{namespace="production"}:{alertname="~"}}',
    "status": "firing",
    "receiver": "diagnosis-engine",
    "groupLabels": {"namespace": "production", "layer": "infrastructure"},
    "commonLabels": {"namespace": "production"},
    "commonAnnotations": {},
    "alerts": [
        {
            "status": "firing",
            "labels": {
                "alertname": "DatabaseConnectionPoolExhausted",
                "severity": "critical", "layer": "infrastructure",
                "impact_type": "resource", "root_cause_candidate": "true",
                "service": "order-service", "namespace": "production",
                "runbook": "RB-DB-001",
            },
            "annotations": {"summary": "DB connection pool at 98%"},
            "startsAt": "2024-11-29T23:47:00Z", "endsAt": "0001-01-01T00:00:00Z",
            "generatorURL": "http://prometheus/graph", "fingerprint": "fp001",
        },
        {
            "status": "firing",
            "labels": {
                "alertname": "ServiceErrorRateHigh",
                "severity": "warning", "layer": "application",
                "impact_type": "availability", "root_cause_candidate": "false",
                "service": "payment-service", "namespace": "production",
                "runbook": "RB-APP-001",
            },
            "annotations": {"summary": "payment-service error rate 12%"},
            "startsAt": "2024-11-29T23:47:30Z", "endsAt": "0001-01-01T00:00:00Z",
            "generatorURL": "http://prometheus/graph", "fingerprint": "fp002",
        },
        {
            "status": "firing",
            "labels": {
                "alertname": "ServiceLatencyHigh",
                "severity": "warning", "layer": "application",
                "impact_type": "performance", "root_cause_candidate": "false",
                "service": "checkout-service", "namespace": "production",
                "runbook": "RB-APP-002",
            },
            "annotations": {"summary": "checkout-service p99 latency 8.2s"},
            "startsAt": "2024-11-29T23:47:45Z", "endsAt": "0001-01-01T00:00:00Z",
            "generatorURL": "http://prometheus/graph", "fingerprint": "fp003",
        },
    ],
}


@pytest.mark.asyncio
async def test_full_pipeline_payment_cascade():
    async with httpx.AsyncClient(base_url=BASE_URL, timeout=30.0) as client:
        response = await client.post("/alerts", json=PAYMENT_CASCADE)

    assert response.status_code == 200
    result = response.json()

    assert result["root_cause_service"] == "order-service"
    assert result["root_cause_alert"]   == "DatabaseConnectionPoolExhausted"
    assert "payment-service"  in result["affected_services"]
    assert "checkout-service" in result["affected_services"]
    assert result["confidence_score"]    >= 0.7
    assert result["recommended_runbook"] == "RB-DB-001"
    assert result["alert_count"] == 3


@pytest.mark.asyncio
async def test_health():
    async with httpx.AsyncClient(base_url=BASE_URL, timeout=5.0) as client:
        r = await client.get("/health")
    assert r.status_code == 200
    assert r.json()["status"] == "ok"


@pytest.mark.asyncio
async def test_resolved_bundle():
    resolved = {**PAYMENT_CASCADE, "status": "resolved"}
    async with httpx.AsyncClient(base_url=BASE_URL, timeout=10.0) as client:
        r = await client.post("/alerts", json=resolved)
    assert r.status_code == 200
Run All Tests
# Unit tests
pytest tests/test_diagnosis.py -v

# Integration tests (start services first)
docker-compose up -d
pytest tests/test_integration.py -v --asyncio-mode=auto

# Full coverage report
pytest tests/ --cov=src --cov-report=html --cov-report=term-missing
Kubernetes Deployment
📁 GitHub file: k8s/deployment.yaml
apiVersion: apps/v1
kind: Deployment
metadata:
  name: diagnosis-engine
  namespace: monitoring
spec:
  replicas: 2
  selector:
    matchLabels:
      app: diagnosis-engine
  template:
    metadata:
      labels:
        app: diagnosis-engine
    spec:
      serviceAccountName: diagnosis-engine
      containers:
        - name: diagnosis-engine
          image: your-registry/diagnosis-engine:latest
          ports:
            - containerPort: 8080
          env:
            - name: SLACK_WEBHOOK_URL
              valueFrom:
                secretKeyRef:
                  name: oncall-secrets
                  key: slack-webhook-url
            - name: OPENAI_API_KEY
              valueFrom:
                secretKeyRef:
                  name: oncall-secrets
                  key: openai-api-key
          resources:
            requests:
              cpu: 200m
              memory: 256Mi
            limits:
              cpu: 500m
              memory: 512Mi
          readinessProbe:
            httpGet:
              path: /health
              port: 8080
            initialDelaySeconds: 5
            periodSeconds: 10
          livenessProbe:
            httpGet:
              path: /health
              port: 8080
            initialDelaySeconds: 15
            periodSeconds: 20
---
apiVersion: v1
kind: Service
metadata:
  name: diagnosis-engine
  namespace: monitoring
spec:
  selector:
    app: diagnosis-engine
  ports:
    - port: 8080
      targetPort: 8080
---
apiVersion: rbac.authorization.k8s.io/v1
kind: ClusterRole
metadata:
  name: diagnosis-engine
rules:
  - apiGroups: ["apps"]
    resources: ["deployments"]
    verbs: ["get", "list", "patch", "update"]
  - apiGroups: [""]
    resources: ["pods", "pods/log"]
    verbs: ["get", "list"]
---
apiVersion: rbac.authorization.k8s.io/v1
kind: ClusterRoleBinding
metadata:
  name: diagnosis-engine
roleRef:
  apiGroup: rbac.authorization.k8s.io
  kind: ClusterRole
  name: diagnosis-engine
subjects:
  - kind: ServiceAccount
    name: diagnosis-engine
    namespace: monitoring
Dockerfile
📁 GitHub file: Dockerfile
FROM python:3.12-slim

WORKDIR /app

RUN apt-get update && apt-get install -y --no-install-recommends ansible \
    && rm -rf /var/lib/apt/lists/*

COPY requirements.txt .
RUN pip install --no-cache-dir -r requirements.txt

COPY . .

RUN ansible-galaxy collection install kubernetes.core

EXPOSE 8080

CMD ["uvicorn", "main:app", "--host", "0.0.0.0", "--port", "8080", "--workers", "2"]
docker-compose.yml
📁 GitHub file: docker-compose.yml
version: "3.9"
services:
  diagnosis-engine:
    build: .
    ports:
      - "8080:8080"
    environment:
      - SLACK_WEBHOOK_URL=${SLACK_WEBHOOK_URL}
      - OPENAI_API_KEY=${OPENAI_API_KEY}
    depends_on:
      - redis

  redis:
    image: redis:7-alpine
    ports:
      - "6379:6379"
The Cultural Change Framework
Architecture alone is not enough. The system changes are only durable if they are paired with organizational changes that reassign accountability from individuals to teams.
Principle 1: Alert authorship equals alert ownership. Every alert rule must have a named team as its owner in the label set (team: payments). That team is responsible for the signal quality of their alerts, reviewed quarterly. Alert noise is a team metric, not an individual failing.
Principle 2: Noisy alerts are bugs. If an alert fires and the on-call engineer determines it was not actionable, filing a ticket for that alert is now required procedure, not optional. An alert that fires twice with no action taken is a P2 bug with an SLA for resolution.
Principle 3: Postmortems review the system, not the engineer. The right questions are not "What did the on-call engineer do?" but "Why was the diagnosis not automated? Why did the runbook not prevent this?" The engineer is a symptom. The system is the cause.
Principle 4: Rotation health is a team metric. Track pages per rotation, time-to-diagnose, auto-resolution rate, false positive rate, and engineer-reported rotation health weekly. When these numbers are bad, the conversation is with engineering leadership about system investment, not with individual engineers about resilience.
Principle 5: Build for the engineer who is half-asleep. Every piece of on-call tooling should be designed with the assumption that the person using it has been awake for 18 hours and has 30 seconds of working memory available. If the runbook has more than five steps, it should be a program. If the alert message does not tell you what to do, it should not be an alert.
Measuring Success
Metric | Target | How to measure |
|---|---|---|
Pages per rotation week | Reduce by 70% | PagerDuty weekly report |
Time to diagnose (MTTD) | Under 5 minutes | Alertmanager timestamp to Slack timestamp |
False positive rate | Under 10% | Post-incident survey: "Was this page actionable?" |
Auto-resolution rate | Over 40% of P2 incidents | Runbook automation success logs |
Engineer rotation health score | Above 7/10 | Weekly anonymous survey |
Alert deduplication ratio | Over 10:1 |
|
The Manifesto in One Paragraph
On-call burnout is a measurement problem, an architecture problem, and an accountability problem. It is not a people problem. The engineer who burned out after 90 pages in 30 days did not lack resilience. They were operating in a system that was designed to fail its humans. The fix is not hiring more engineers to absorb the same noise. The fix is designing a system where the noise does not reach humans in the first place: where alerts group by causality, where diagnosis runs automatically, where runbooks are programs not documents, and where accountability for alert quality sits with teams and systems, not with the individual who happened to be on-call when the chaos hit. You can build this system today. Every layer described in this article uses tools that are free, open-source, and already in your stack. The only thing preventing you from implementing it is the assumption that on-call suffering is inevitable. It is not. It is a design choice. And design choices can be changed.
Full source code: https://github.com/SubhanshuMG/oncall-burnout-fix
If this post helped you think differently about on-call architecture, share it with the engineering leader in your organization who controls your monitoring budget. That is the right person to read this.